Parking concept Berlin-Mitte
The district Berlin-Mitte is subject to a steady and rapid development and shows an increase in conflicts of use in relation to stationary traffic. Due to that, a re-assessment and review of the parking management zones should be carried out after more than ten years.
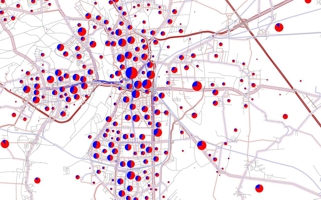
Initially, an extensive survey of approx. 48,000 parking spaces in the public and private sector was carried out and the demand for parking space was determined by recording the occupancy and a partial survey of the number plates. The number plate survey to distinguish the benefit groups was carried out on site with tablets using the company's own app CarPark, which was successfully tested thereby. From the results, zones with extremely high parking pressure could be derived. In addition, a review of the existing parking arrangements was carried out with regard to the type of management and management time, as well as the level of charges and the obligation to charge, from which recommendations and corresponding measures were derived for adequate use in the following areas:
- Management forms and times,
- fees,
- parking zone classification.


Parking space utilization at a specific time Screenshot of the CarPark App
For more Information, please refer to our factsheet 2,2 MB.
Traffic investigation Magdeburg-Ostelbien

Against the background of a dynamic development of the state capital Magdeburg, a traffic investigation for the eastern districts should be carried out. The multimodal considerations should consider possible changes to the network configuration, including a relief road for the eastern districts, and, if necessary, reorganise the development of public transport.
First, the transport model of the city of Magdeburg had to be continued. In addition, the traffic districts were revised and disaggregated and event traffic was modelled. Subsequently, an analysis of existing Elbe crossings was carried out, as there are a number of possibilities for various means of transport to cross the Elbe, which are bridges, but also ferry connections.
The following inventory analysis of all transport participants was supported by traffic surveys and SWOT analyses. Subsequently, it was about the development of variants and planning cases for the possible management of a relief road. For the ten variants developed, the effect of various criteria was determined by macroscopic transport demand modelling. The criteria assessed were: relief effect of the city centre, relief effect of Cracau, modal split, traffic performance, event traffic and disaster, nature conservation, urban and landscape design, construction costs.
As a result, the variants were presented with evaluation and weighing and a preferred variant was proposed.


Site plan variants without additional Origin-Destination Distribution on selected cross-sections
Elbe crossing

Evaluation - number of paths
Methods and characteristics for estimating traffic effects
Spatial and transport planners often have the task of estimating the volume of traffic and the choice of means of transport for planned construction objects of different types of use (e.B. trade, large- and small-scale retail, various services). In particular, the choice of means of transport is highly dependent on the local spatial structure and the transport offer (e.B. stop and cycle density in public transport).
In practice, there is usually a need for procedures for simple determination of transport production and the choice of means of transport. For this purpose, a number of tools, often MS Excel-based, already exist, which use empirical survey data. However, these Tools often have considerable ranges of variation among themselves, lack of definitions of the field of application and insufficiently comprehensible documentation of the data origin, which makes comprehensible and reliable statements difficult.
Existing internationally applied procedures and characteristics for the estimation of traffic production were critically examined in the project and statements on the specific strengths and weaknesses were derived from this.
Based on this, an easy-to-use tool was developed in which the expected traffic volume and the choice of means of transport for different object types can be determined according to local conditions such as the public Transport infrastructure provision class, population and workplace density, the language area and other parameters. The data base is formed by the path and stage data of the Swiss microcensus Mobility and Transport, which were enriched by the spatial reference with the local parameters such as public Transport infrastructure provision class, population and workplace density, etc. When choosing a mode of transport, combined routes such as B&R, P&R and K&R are also indicated in the developed tool.
The developed tool is available under www.mobilityplatform.ch. For more information, please refer to our factsheet 1,2 MB.

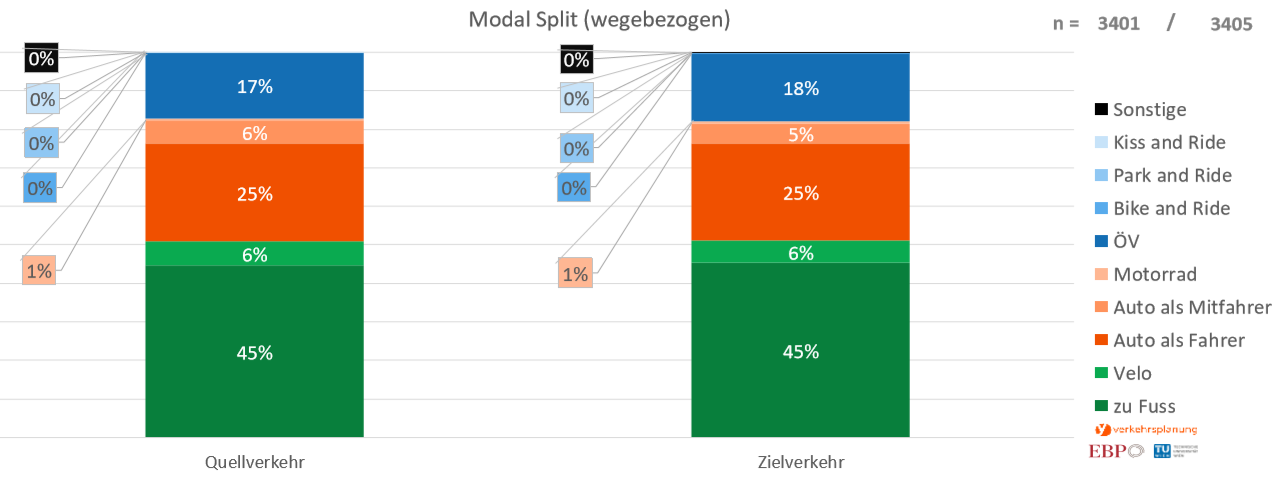
Determination of parameters Modal split tool, result display
at the start and finish point
Research project BahnRaum
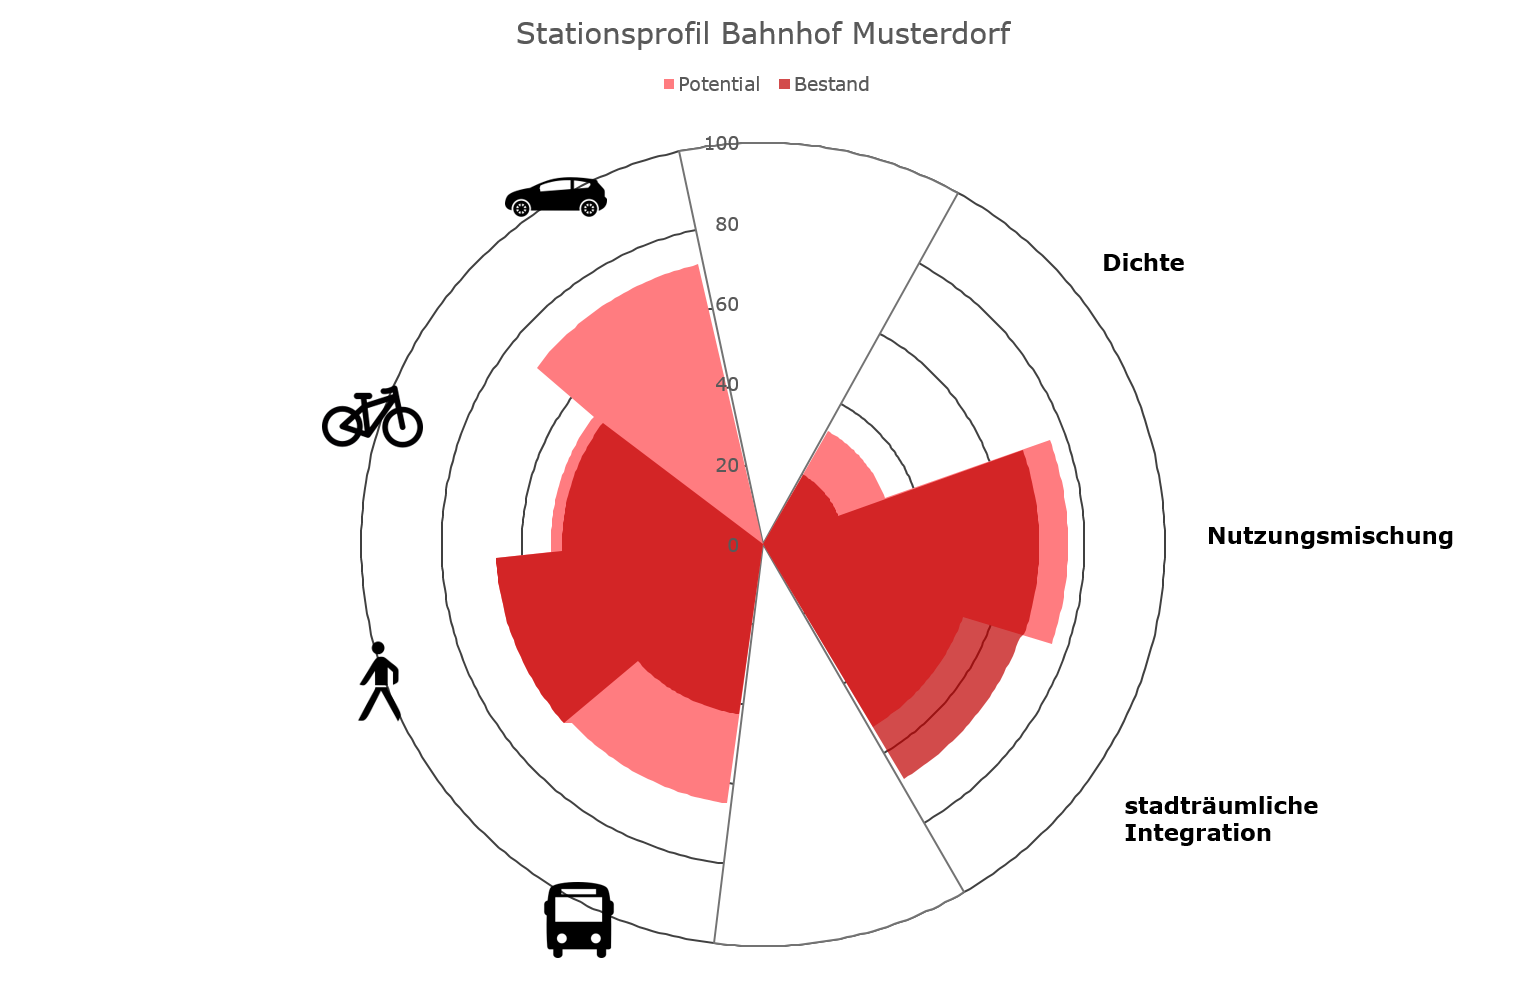
The research project BahnRaum deals with the strategies for rail-oriented settlement development and acccessibility optimization at transport stations on a local and regional level. The focus is set on rural areas as well as on smaller urban areas. BahnRaum was realized in cooperation with the following project partners:
- Vienna University of Technology, Faculty of Spacial Planning, Department of Transport System Planning
- Vienna University of Technology, Institute of Transport Science, Research Area for Transport Planning and Technology
- stadtland, DI Sibylla Zech GmbH
As part of an analysis of the state of the art, existing methods from spatial and traffic planning as well as tools for accessibility measurement (GIS network analysis tools, land use models, macroscopic traffic modelling) were first investigated and evaluated.
On the basis of case studies, it was shown how planning processes involving relevant actors, combinable strategies (settlement development, adaptation of the station network, adaptation of the degree of expansion and improvement of the traffic link), planning instruments and methods succeed in improving the potential of the railway through active spatial planning and, conversely, positively influence the spatial development by the railway as a driving force.
For five test regions in Upper Austria and Carinthia, accessibility analyses were carried out with the multimodal networker of the graphene integration platform (gip.at). For this purpose, the project developed its own PostgreSQL/ PostGIS scripts in which an automated linking of isochrone calculations with the structural data potentials takes place on site.
TechnoVep
Currently, a wide range of planning tools for regional and transport planning purposes are available, e.g. geographic information systems, transport planning models or urban simulation models. Simultaneously, the development of innovative planning tools is advancing at a dynamic pace: new methods, procedures and technologies are continuously created and advanced. These new planning tools may not be able to substitute the knowledge of experienced designers in practice, but innovative planning tools have great potential to improve the quality of regional and transport planning by means of being more realistic and allowing better transparency, faster processing and a graphically more vivid presentation. Establishing planning tools in practice first depends on the fact whether and to which extent
- the problem of the planning task justifies their use,
- the users accept the planning tools.
Social and economic trends result in increasingly complex planning tasks in the field of regional and transport planning. On the other hand, different users, such as designers, persons concerned or politicians, both impose different requirements on planning tools and show diverging experiences, competencies and habits in using these tools.
Technological trends act as catalysts for creating and developing planning tools. Relevant key technologies are Web 2.0 and GeoWeb, technologies for data collection, visualisation and communication, mobile computing and a higher performance hardware for visualisation and transport planning models.
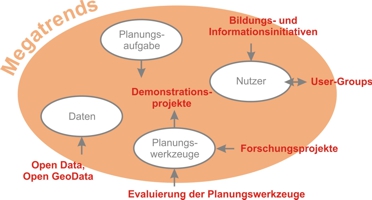
Developing knowledge of methods and instruments, gathering experience with planning tools and building confidence aim directly at increasing the user acceptance of innovative planning tools. Education and training measures as well as initiating user groups, demonstration projects and evaluating the planning tools in empirical studies constitute promising approaches. Further, freely available data (open-governmental data, open-source data), building up (geographic) information systems and an open-minded innovation and planning structure contribute to a wider use of planning tools in the practice and, therefore, to an improved planning quality.

The user survey clearly demonstrates a lower demand on new planning tools but a higher one on improving existing planning tools.
In order to push the use of planning technologies, recommendations for action have been developed in the area of conflict between planning task, user and planning tools. The figure represented shows interactions and possible approaches.
Multimodal travel demand model Halle (Saale)
The integrated traffic model of the city Halle represents the travel behaviour in the City Halle and its surrounding area. In addition to motor traffic and public transport, the multimodal travel demand model considers pedestrian and cycle traffic as well as motor vehicle fellow passengers. Extending the research area to the neighbouring counties assures urban-rural relationships being treated with particular focus on traffic planning.
Input parameters for the travel demand model are:
- Socio-demographic data (population distribution, age distribution, target opportunities etc.)
- Travel behaviour data (on the basis of household surveys, Mobility in Germany (MID) survey, Mobility in cities (SrV) survey)
- Data regarding transport facilities (transport network for all traffic modes, timetables)
The model allows a realistic representation of the travel demand and its variability throughout the day. Besides the main transport network, the network model includes the complete secondary transport network. The individual turn relationships at the interchanges are modelled dependent on the traffic volume, resistances at traffic light systems were implemented by considering all signal time plans.
Based on the traffic model created in 2011 and last updated in 2018, the model was backed with current mobility data in the next update, a strong differentiation of activities was made and a model for regular professional traffic was built. in addition, mobility rates are inked to household data in the new transport model , thus establishing a connection between these data.
Further information is provided in our factsheet 0,8 MB.
Reduction of negative environmental impacts in Mühlhausen
In recent years, traffic flows have changed significantly as a result of socio-demographic developments and changes in the network structure in northern Thuringia. This led to the necessity of a fundamental revision of the 15-year-old coordination of traffic lights in the course of the B 247. The aim was to reduce the environmental impact by liquidation of traffic. The study was based on a comprehensive empirical assessment of traffic demand in 15 junctions.
In a second step, all traffic light programs were adapted and the existing synchronised traffic Lights, the so called "Green Wave", optimized. The entire traffic flow was tested with the help of a traffic-dependent microscopic traffic flow simulation, on the basis of which the reduction of negative environmental effects could also be demonstrated.